Easily Visualize and Analyze Employee Engagement and Efficiency Data
Break Down Data Silos and Visualize Employee Efficiency Metrics
Siloed data hinders cross-departmental collaboration and communication and can stunt company growth. Breaking down these data silos helps visualize efficiency metrics. Prodoscore aggregates data from core cloud applications into one dashboard, seamlessly integrating with Google Workspace and Microsoft 365 as well as an extensive range of common applications. With Prodoscore, teams can compile and categorize data to visualize how workers are engaged with various software each day.
This helps organizations determine which solutions have limited use, enabling them to streamline your tech stack, optimize license usage, and pinpoint training gaps. Prodoscore gives management complete transparency, helping leaders drill down on which aspects of their organization’s tech stack are most effective and which can be eliminated.
Visualize Organizational Data Trends
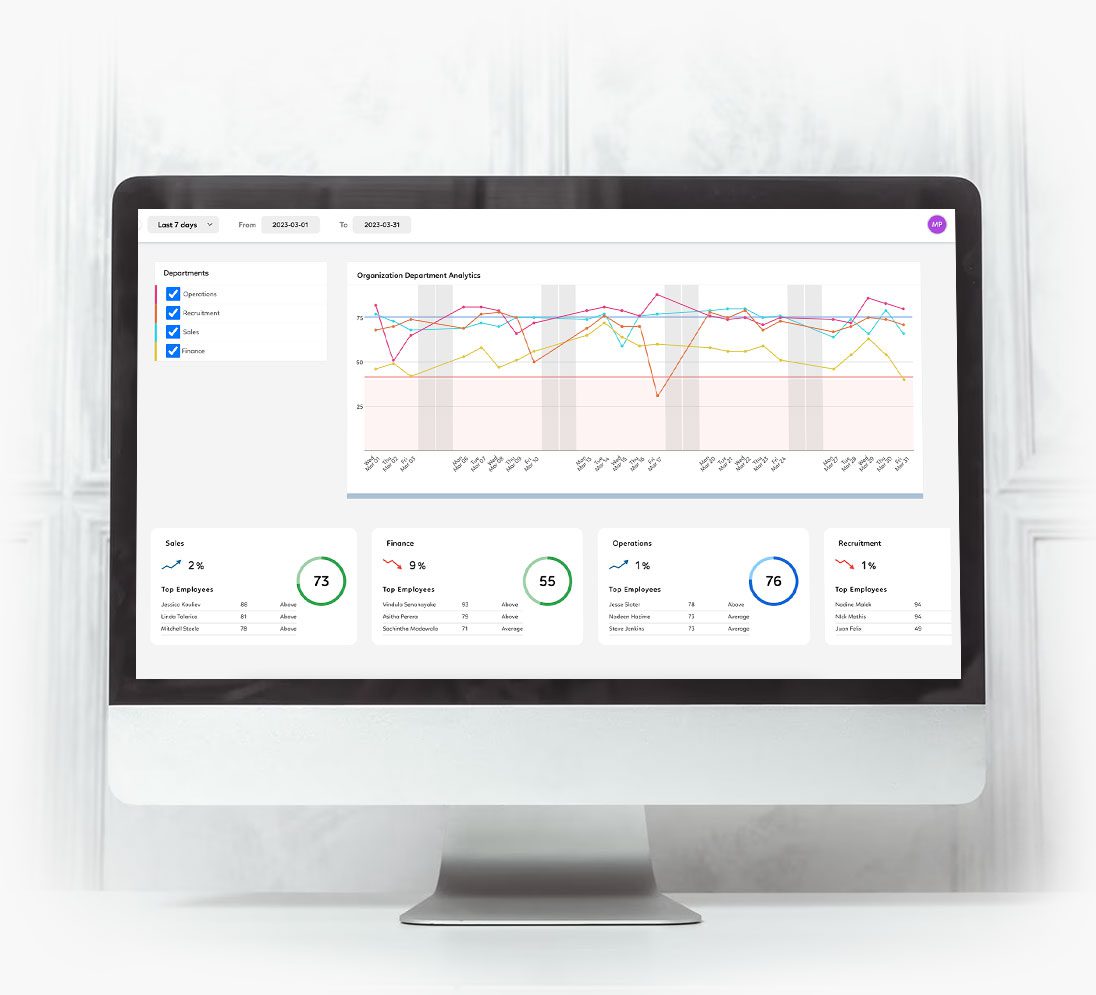
Our platform focuses on the metrics that matter and merges data from your business applications into an easy-to-use data visualization dashboard, presenting it as a simple score. We give you the tools to visualize employee data trends in real time and across time so you can make informed business decisions.
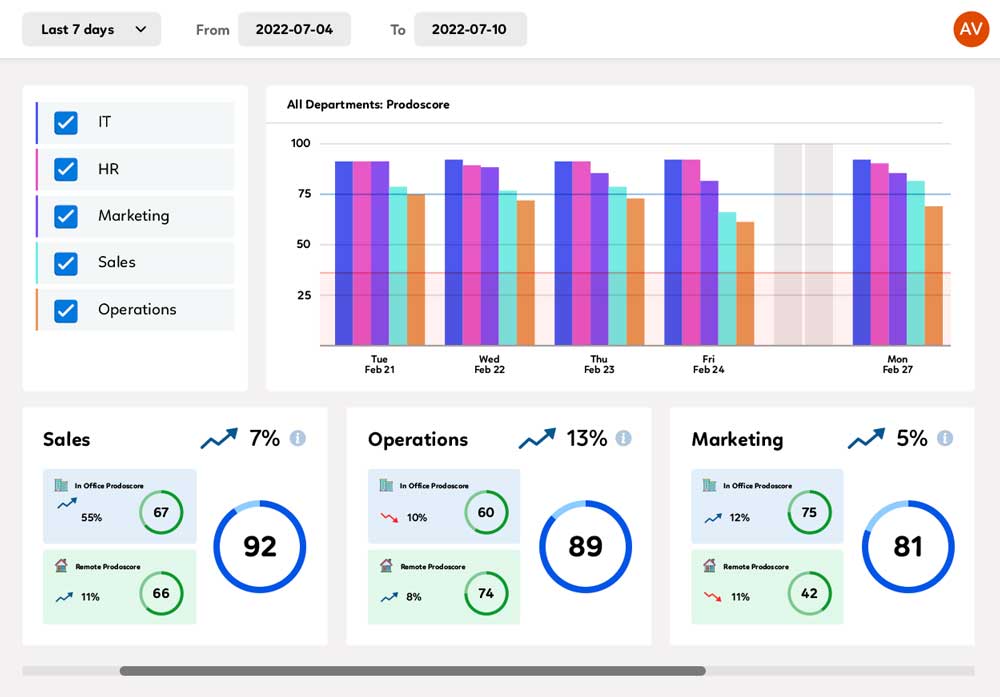
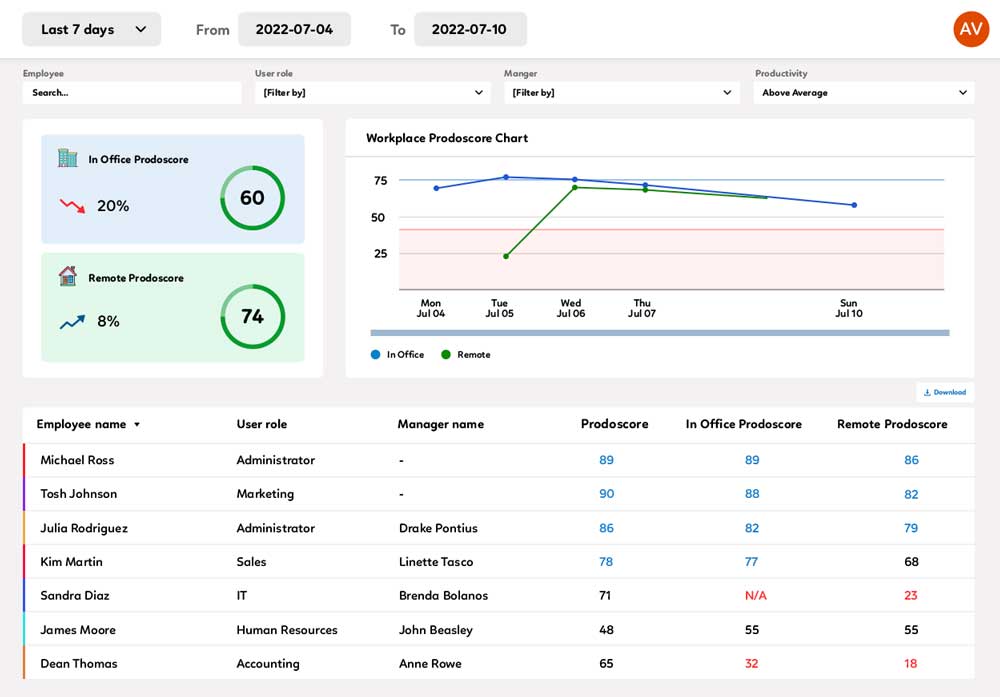
Employee Workplace Productivity
Productivity monitoring tools to gain insight into how employees are engaged remotely vs. in-office.
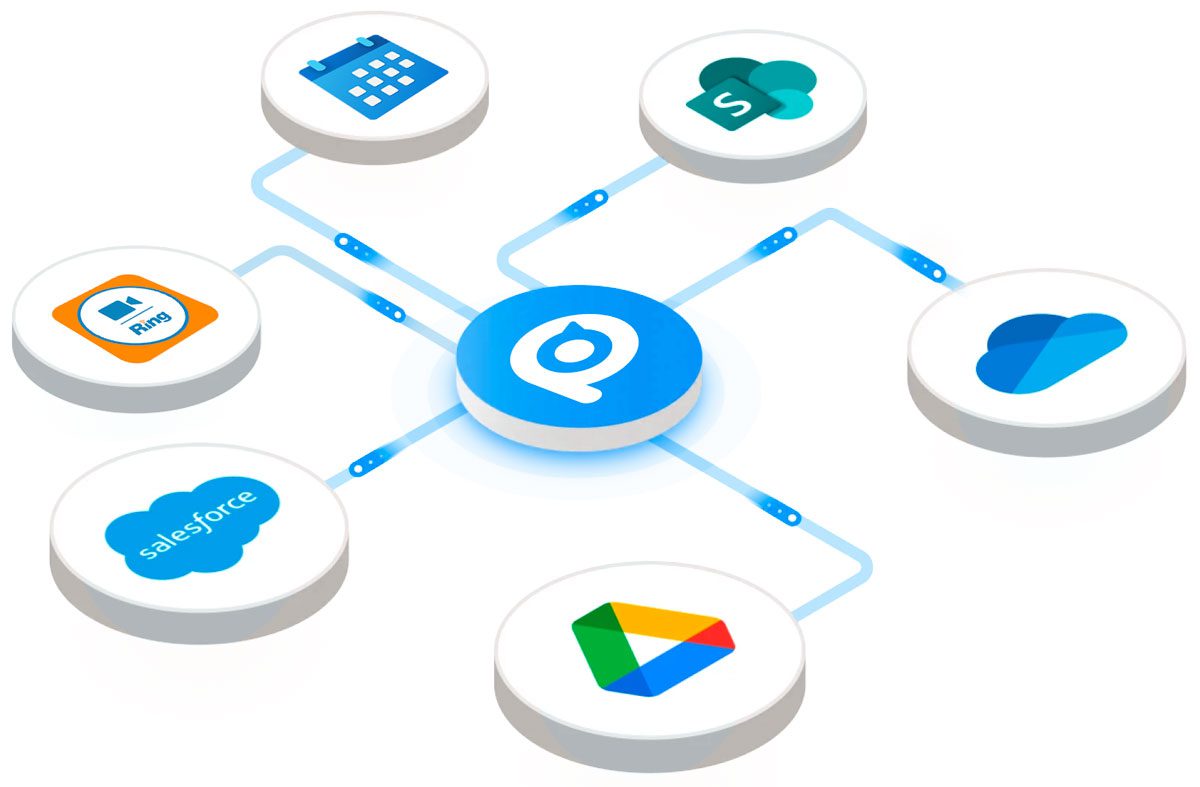
Endless Integrations
Cloud-based API integration means that employee activity data can be captured from multiple devices vs. just a laptop, enabling more flexibility for employees.
More integrations
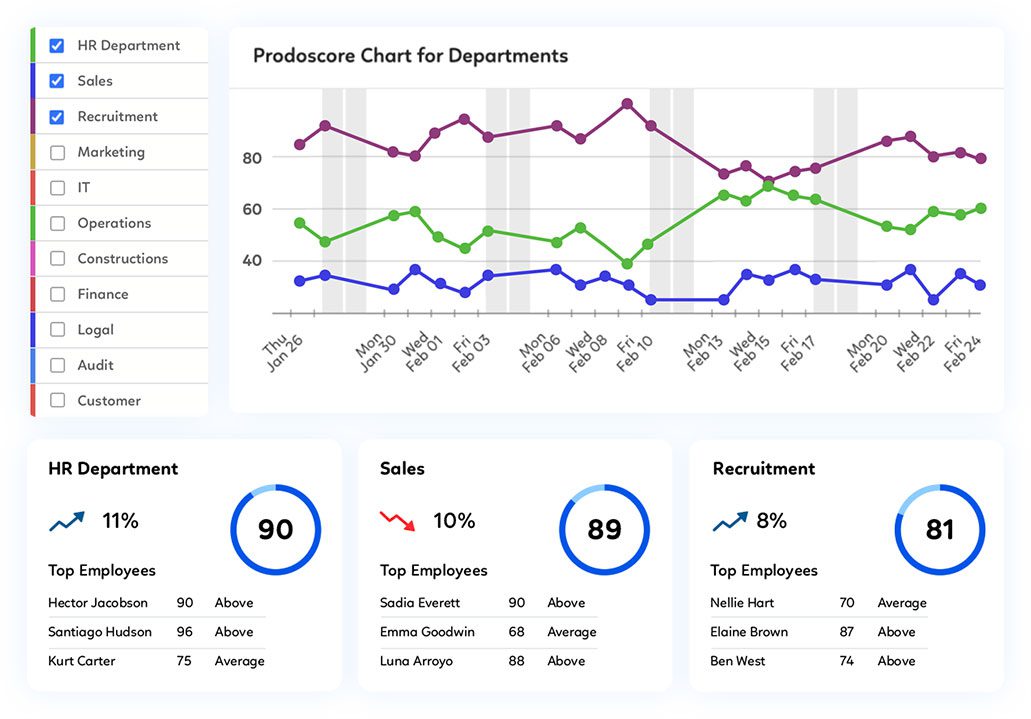
Enterprise-Level Employee Data Solutions
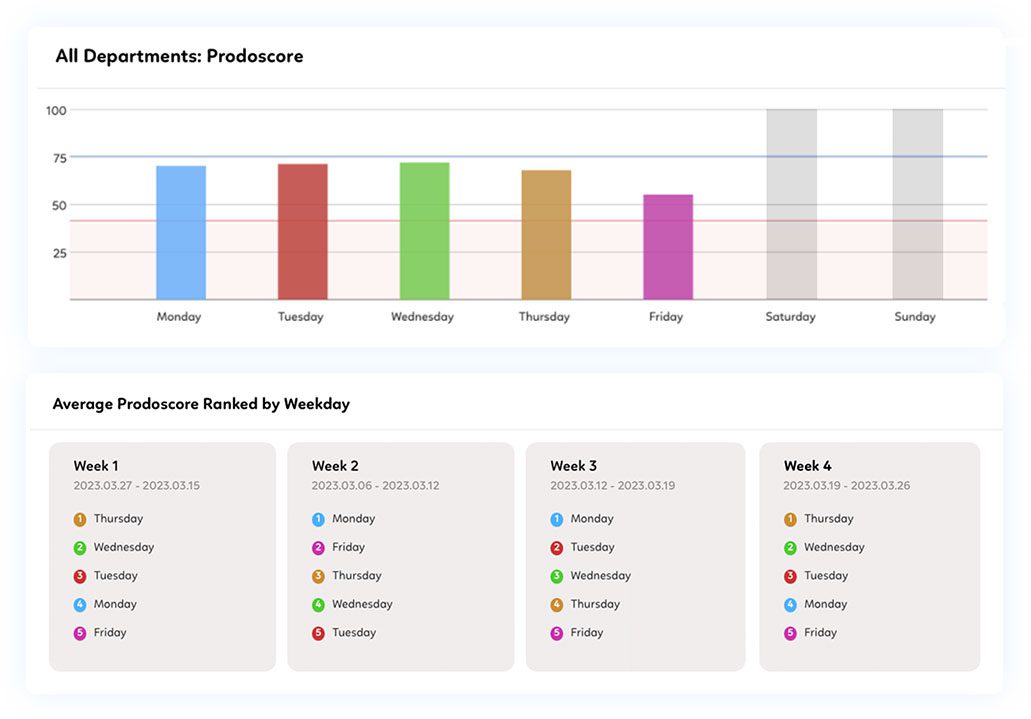
Access engagement and productivity data by department, day and location to understand daily/weekly/monthly data trends, workloads, and more.

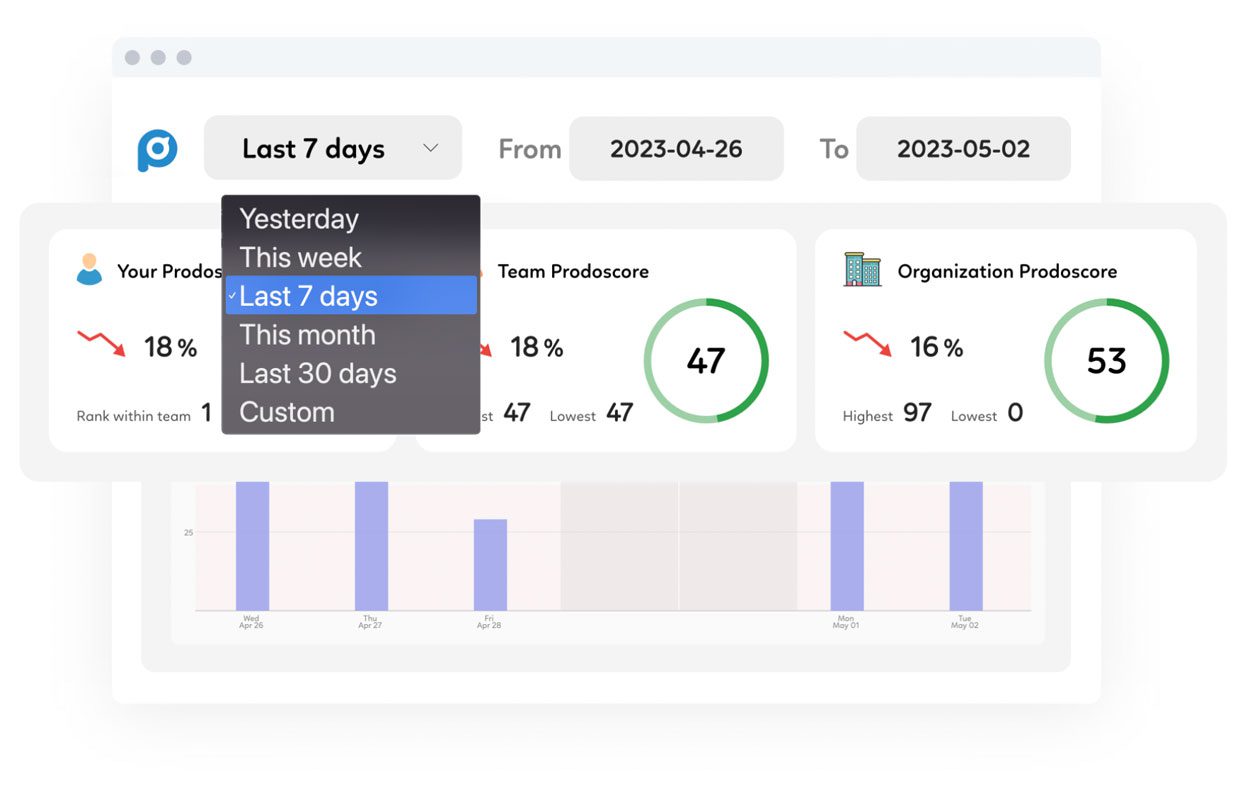
Time Filtering
View and filter trending data over any timeframe.
Product Features
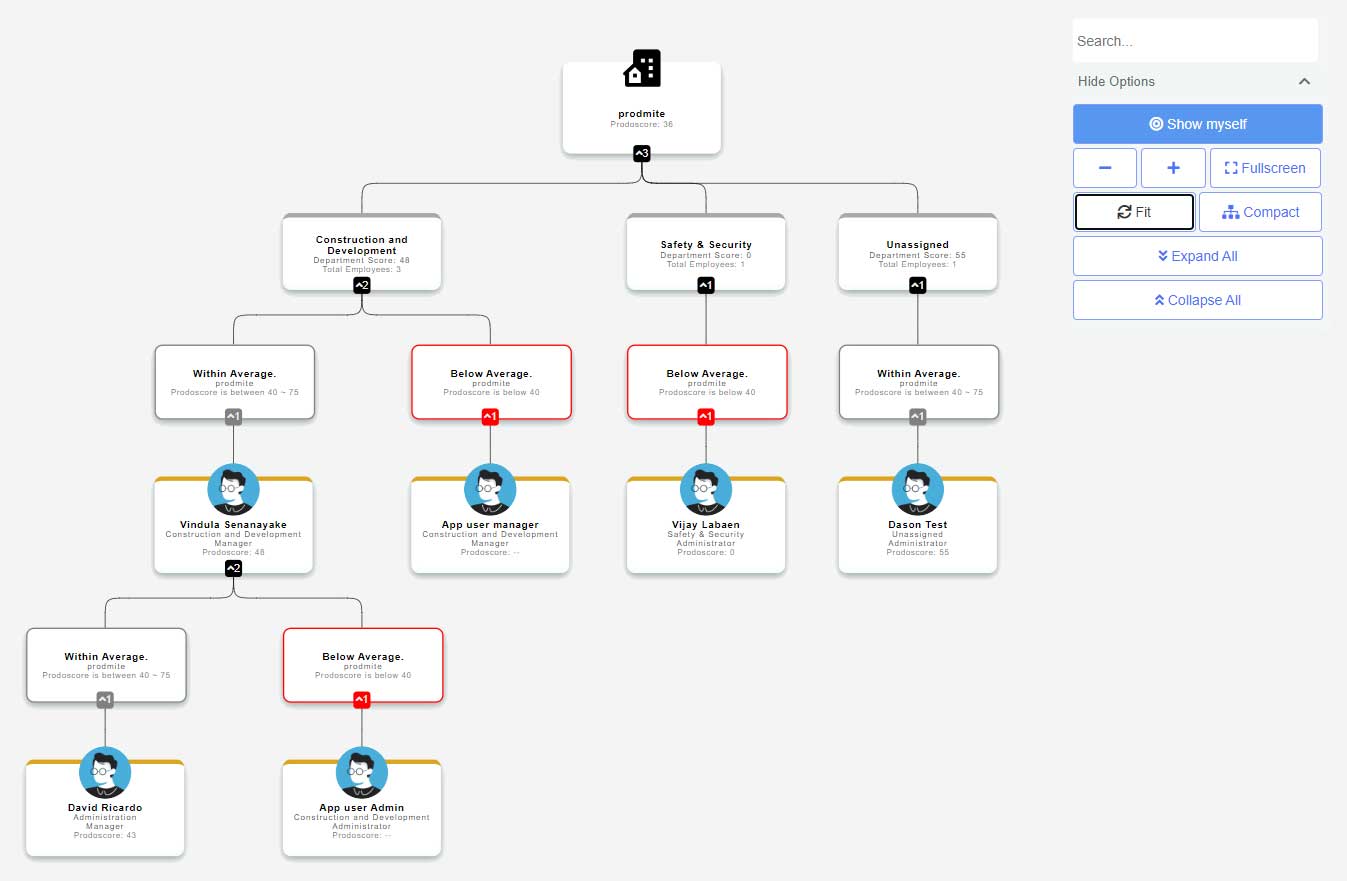
Organizational Hierarchy
Quickly visualize productivity data about a particular team or group of users.
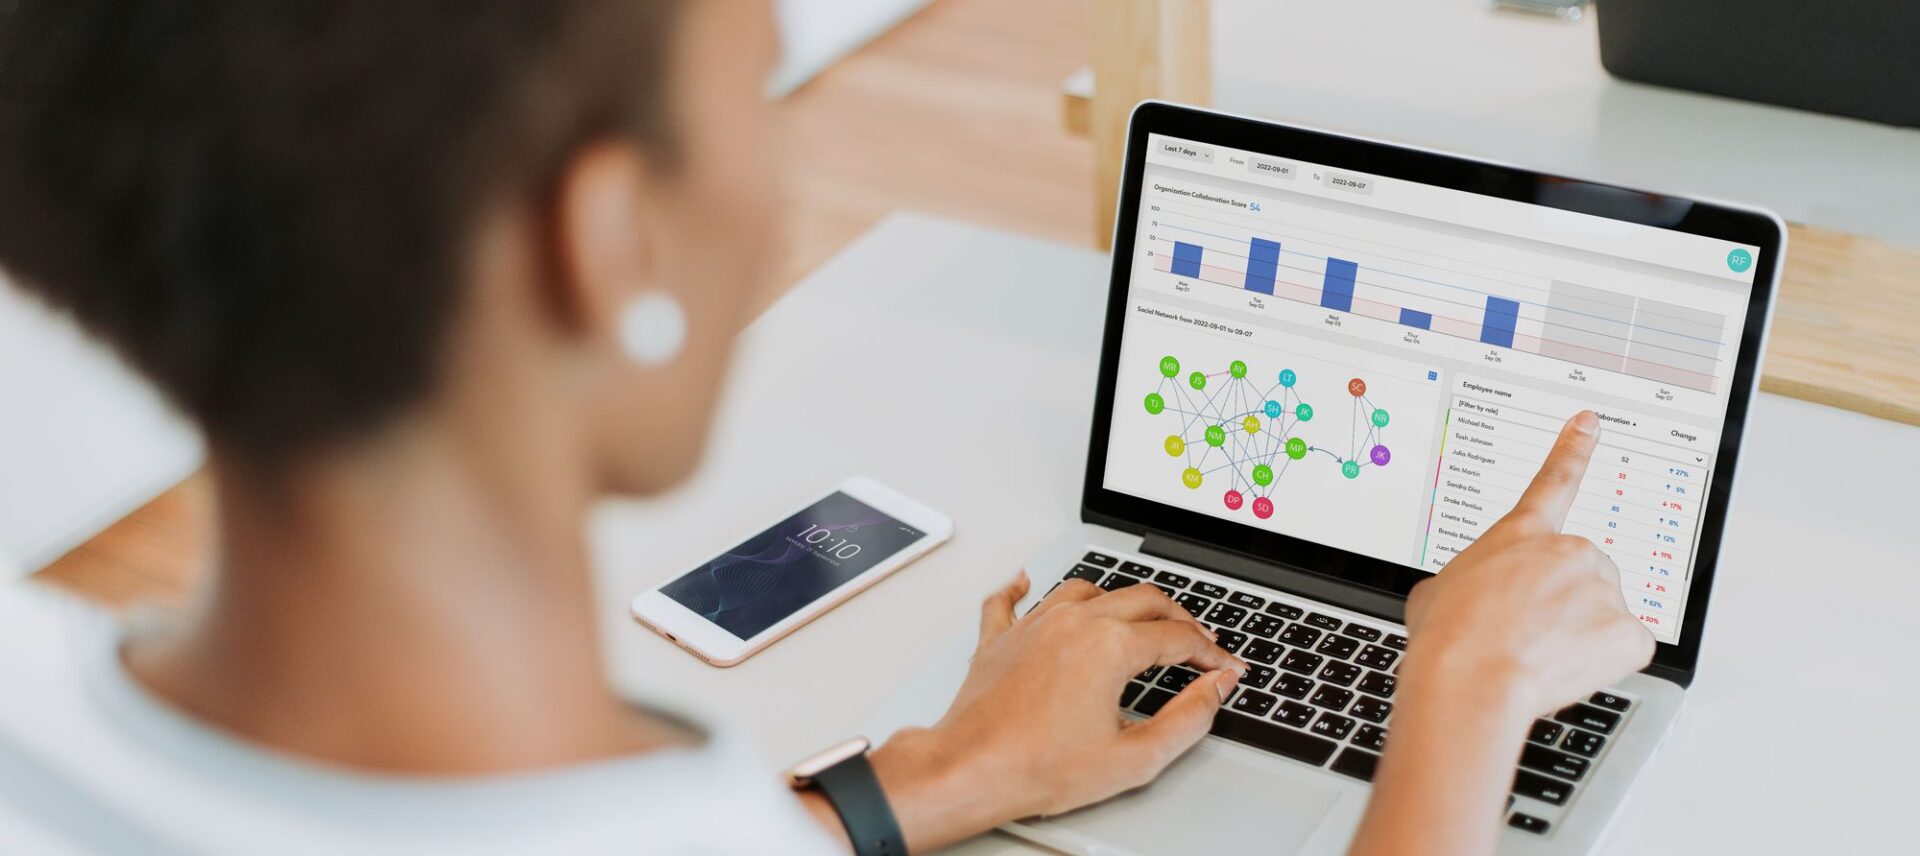
Social Network
Visualize how employees are connected, how they communicate, and what influence they have on each other.
More on Social Network